The 2022 federal pre-election situation:
All 435 House of Representative seats were contested in the 2022 Federal USA Midterms Elections. The Democrat Party held an eight-seat majority in the House of Representatives, and therefore the Republicans did not need a major upset to take the House – house of Representative Seats are two year terms. In the then evenly-divided Senate, only 34 regularly scheduled elections of the 100 seats were up for grabs in the 2022 midterms – Senate terms are six years. 21 of those Senate seats in the 2022 Senate election cycle were currently held by Republicans.
The 2022 Federal Election results:
The United States now has a split party Congress.
The House of Representatives 222 Republicans versus 213 Democrats – Republicans gain new majority of the 435 seat House of Representatives (218 seats or more is required for majority control).
The Senate 51 Democrats versus 49 Republicans (51 seats or more are required for majority control).
What does a split party Congress mean for predicting the future stock markets?
Generally speaking the stock market will rise into a president’s third year in office when there’s a push to stimulate the economy ahead of the next election. The best market stock returns come during this period. For example the S&P 500 rises an average 16% in that third year. In the first six months after a midterm elections, from November to April—the S&P 500 has gained an average of 14.3% and has risen in price 95% of the time.
An election of a Republican Congress with a Democrat president has been the strongest environment for stocks, with the benchmark Standard & Poor’s 500 broad stock market index returning 16.3% on average, annually between 1950 and 2021.
Most data point to an upturn in the S&P 500 after the midterm elections.
-Since 1950, the average return for the S&P 500 in the 12 months after a midterm election is 15%, surprisingly with no down years, John Lynch, Comerica Wealth Management’s chief investment officer, wrote in a report.
-In 17 of the 19 midterms since 1946, stocks performed better in the six months following the election than they did in the six months leading up to it, Liz Ann Sonders, Schwab’s chief investment strategist, said.
-The three quarters from midterms onwards are historically the strongest three quarters, a pattern since 1949, Deutsche Bank says.
– The S&P 500 has in the past outperformed the overall market in the 12-month period after a midterm election, with an average return of 16.3%.
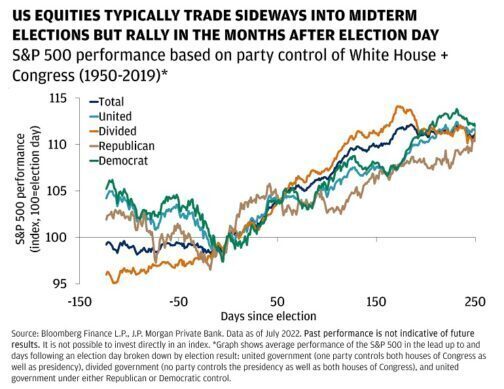
S&P 500 Midterm Election Cycle Chart
NOTE; a divided government re-enforces the checks and balances government system. A divided government would not likely pass any legislation that falls too far from the center of the political spectrum. This means that major legislative packages aimed at higher taxes for individuals or corporations, for example, would likely be off the table for at least the next two years. However, a divided government would also mean that any fiscal rescue package in the event of an economic downturn would also be less likely.
More on the 2022 Federal Election Results and Election Maps by BBC click here.
More on the 2022 Federal Election Results and Graphs by Forbes click here.
More about how midterm elections affect the stock market by US Wealth Management click here.
I hope the above information was of interest to you.
Anthony at TradeCurrencyNow,
America’s Forex News and Currency Information Source.
The above information is opinion based except where noted. This web page and website information is NOT trading advice. Always contact a licensed professional for information on the above subject or BEFORE applying or practicing the above information.