How Stocks Perform With or Without Santa Showing Up

The Santa Claus Rally historically usually delivers strong market returns during such a short time frame (from 12-22-23 and ends on the second trading day of January):
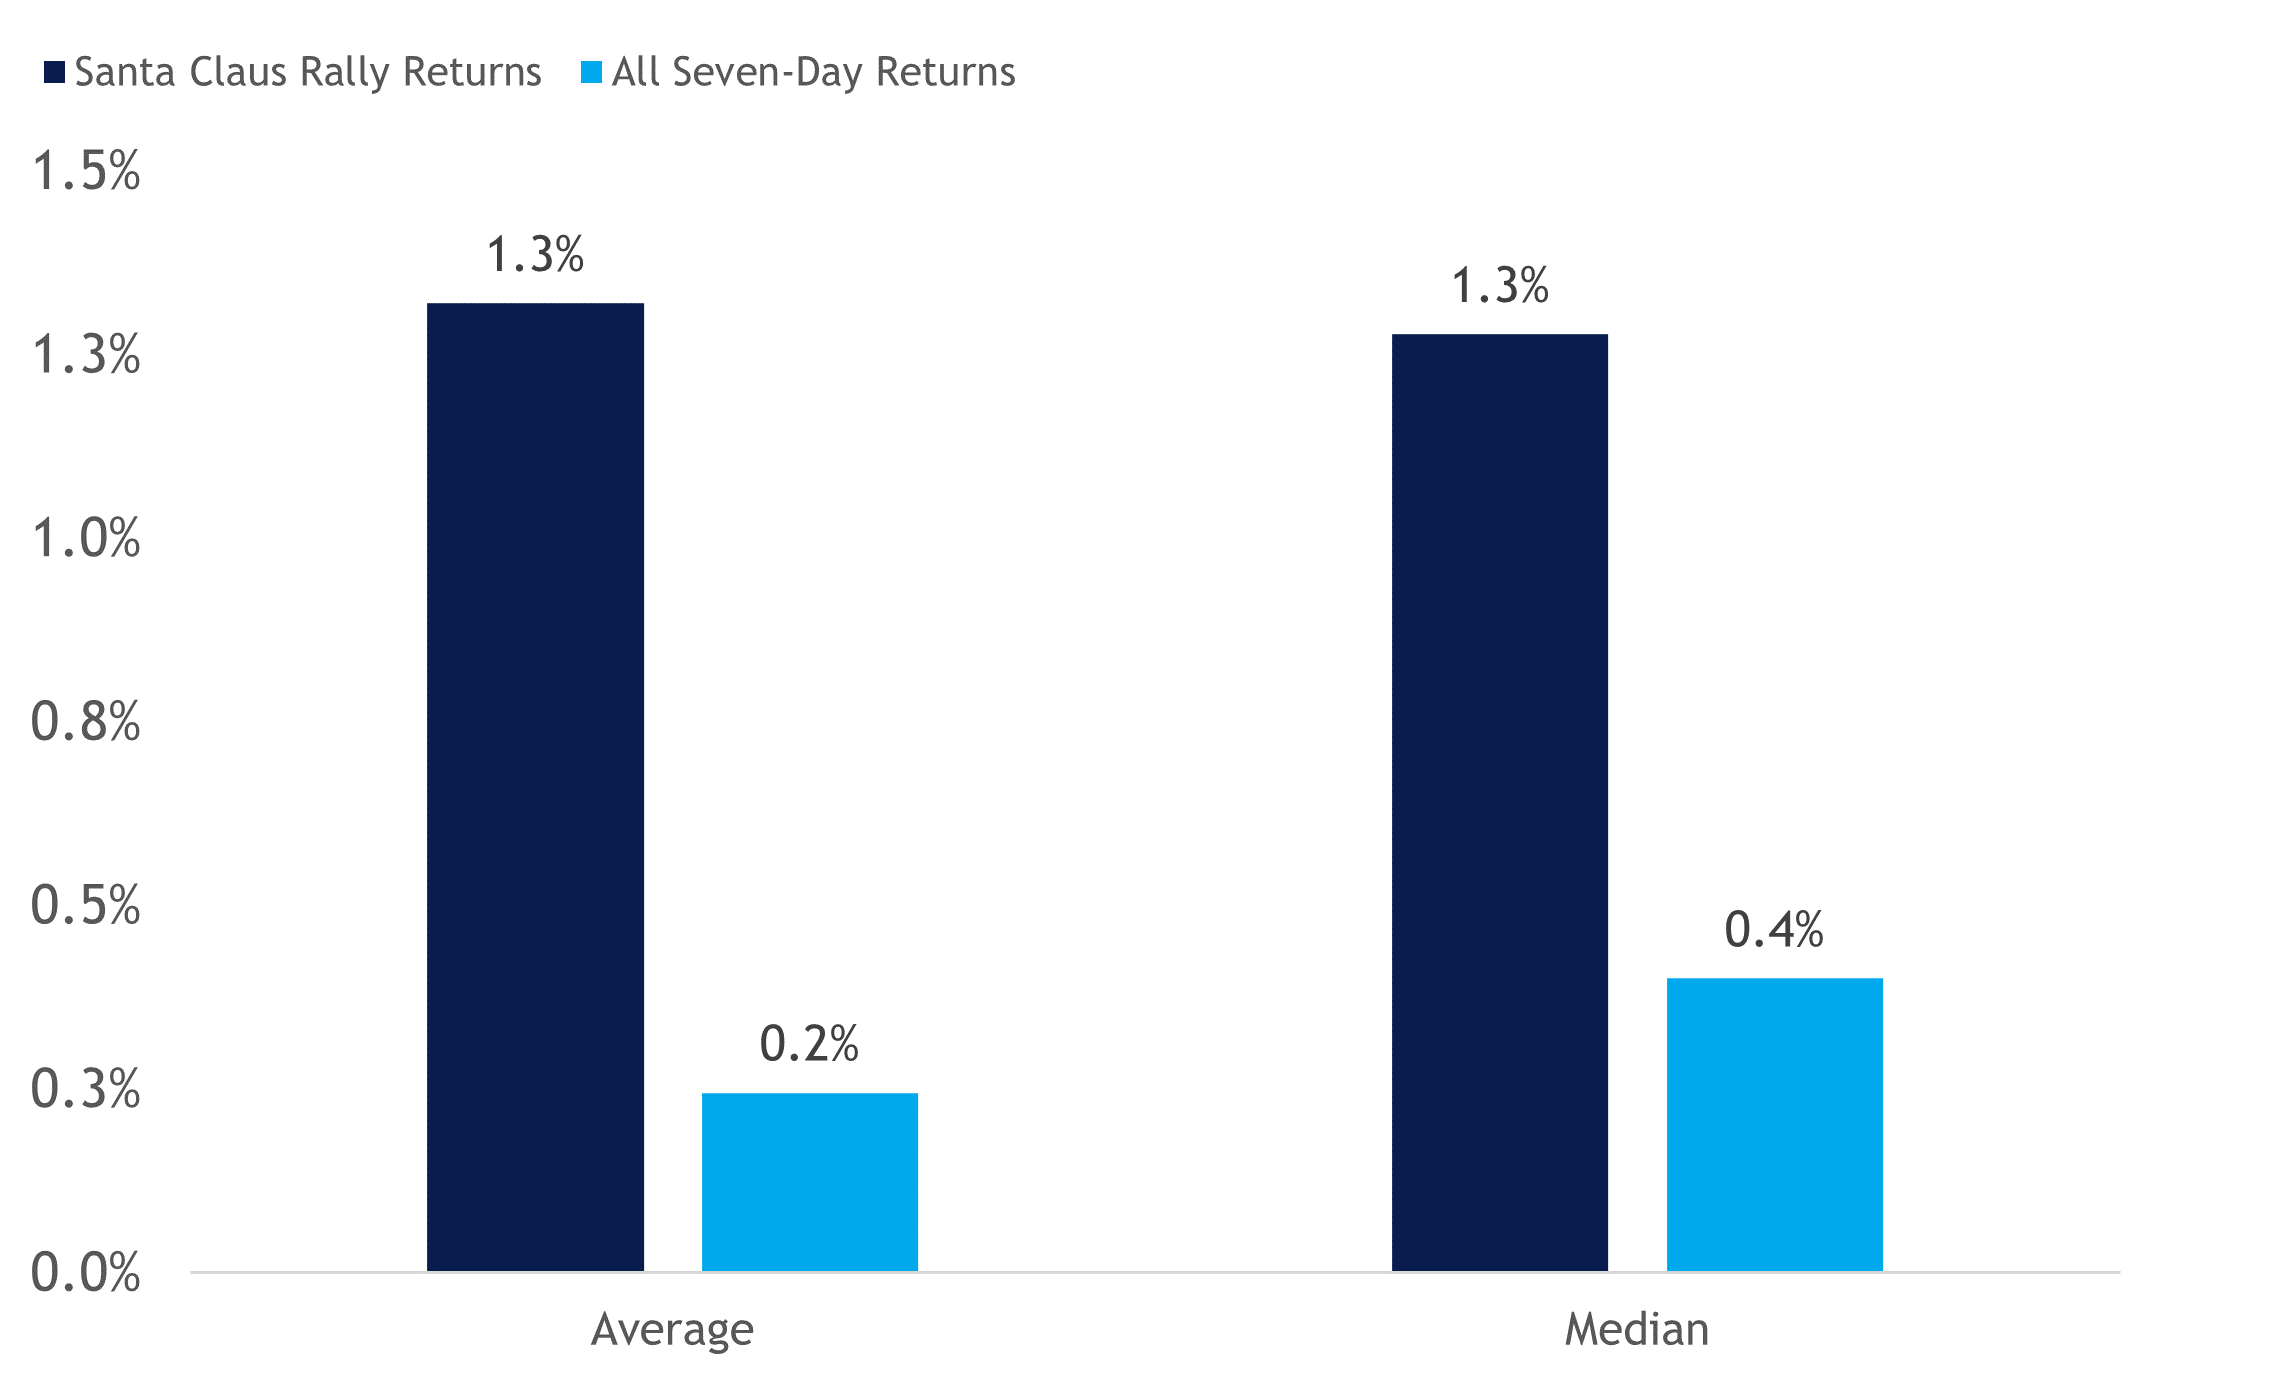
As highlighted in the chart below, the S&P 500 has generated average and median returns of 1.3% during the Santa Claus Rally period, compared to only 0.2% and 0.4% average and median returns for all rolling seven-day returns, respectively.
Please refer to the below Santa Clause Rally History bar chart as sourced at LPL Research, Bloomberg 12/22/23.
Source: LPL Research, Bloomberg 12/22/23

The Santa Claus Rally Historically Delivers Above-Average Gains

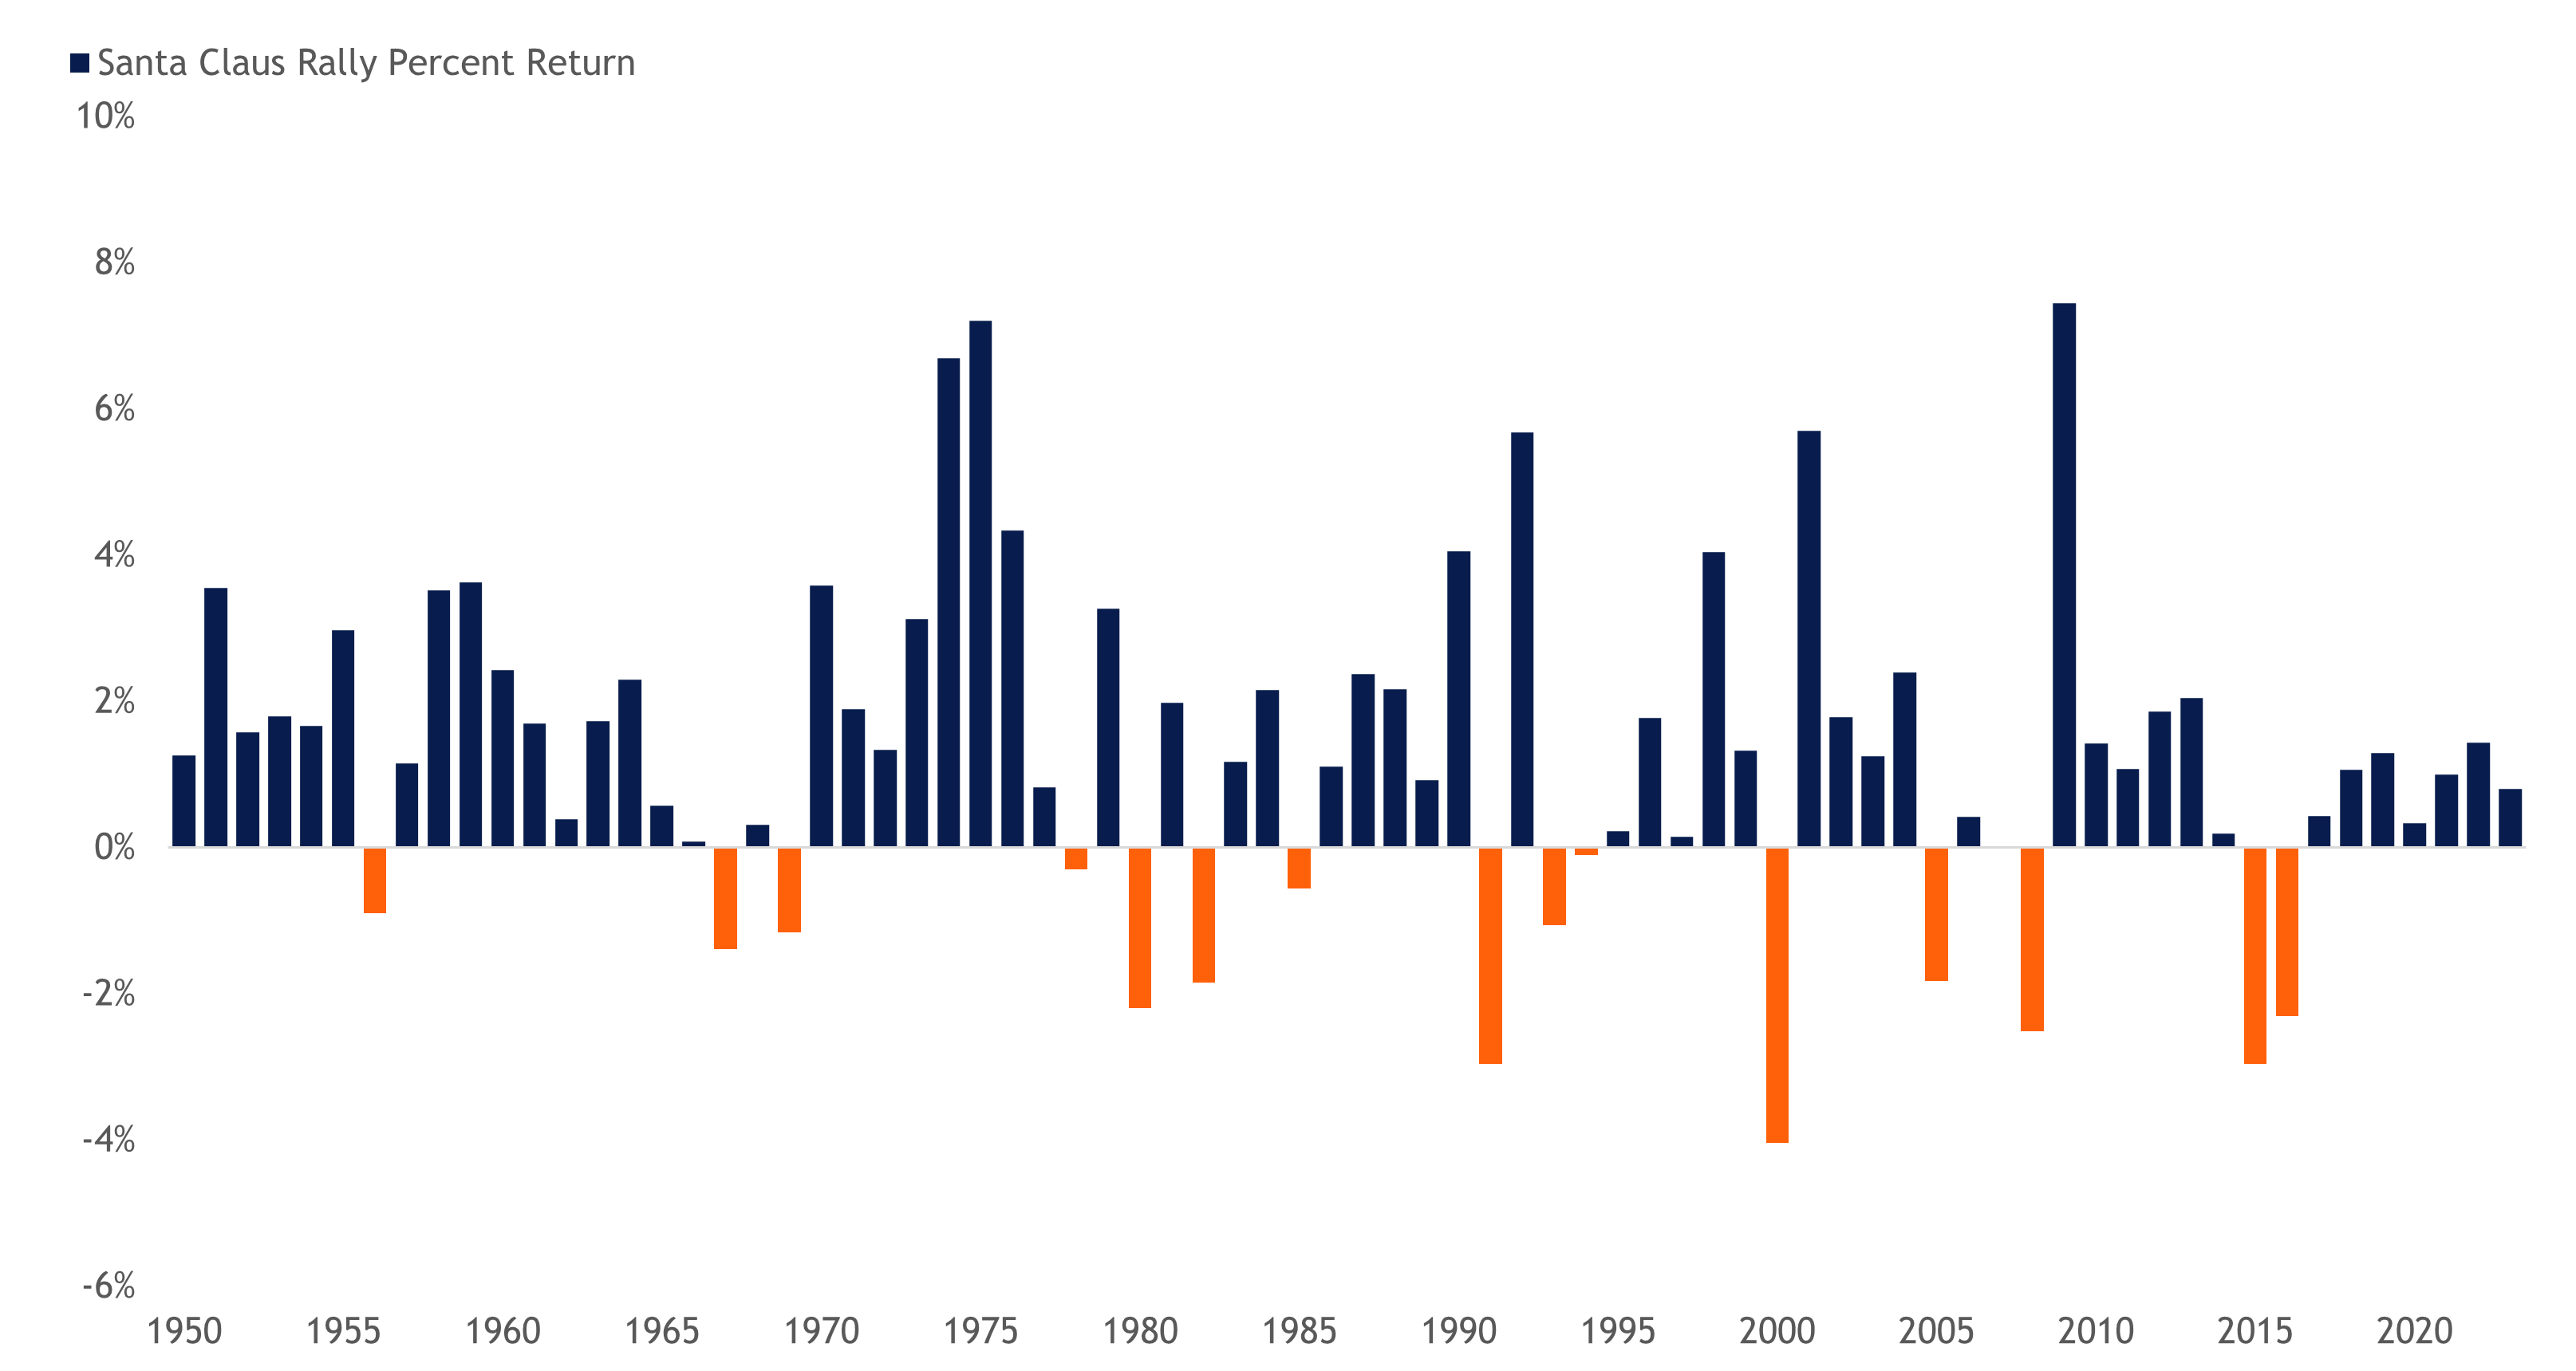
When the S&P 500 finishes higher during this year’s Santa Claus Rally, it will mark the eighth consecutive period of positive returns. The longest streak was 10 back in the mid-1960s. However, as highlighted in the table below, positive returns during the Santa Claus Rally are relatively common, as the market has advanced 80% of the time during this period. All rolling seven-day returns for the S&P 500 since 1950 have a positivity rate of only 58%.
Please refer to the below Santa Clause Rally Chart as sourced at LPL Research, Bloomberg 12/22/23.

S&P 500 Santa Claus Rally Returns by Year from 1950 through to 2022
Source: LPL Research, Bloomberg 12/22/23

How Stocks Perform With or Without Santa Showing Up

For more on the above chart and this Santa Clause Rally Theory by LPL Financial click here.

To view another theory on the Santa Clause Rally at Trade Currency Now Forex Blog click here.

NOTES ON WHY PAST HISTORY MAY NOT BE A TRUE INDICATOR FOR TODAY’s MARKET: Keep in mind that we are in some unusual financial times with government overreach/market manipulation, hyper inflation, high spending through FED monetary easing and 2024 is a presidential election year on the opposite side we have high debt, highly leveraged markets, wars and attacks and the next pandemic that can crash a market.


I hope the above information was of interest to you.

Anthony at TradeCurrencyNow,
America’s Forex News and Currency Information Source.

The above information is opinion based except where noted. This web page and website information is NOT trading advice. Always contact a licensed professional for information on the above subject or BEFORE applying or practicing the above information.
S&P 500 Positive Christmas or Negative Christmas History – Grinch Indicator

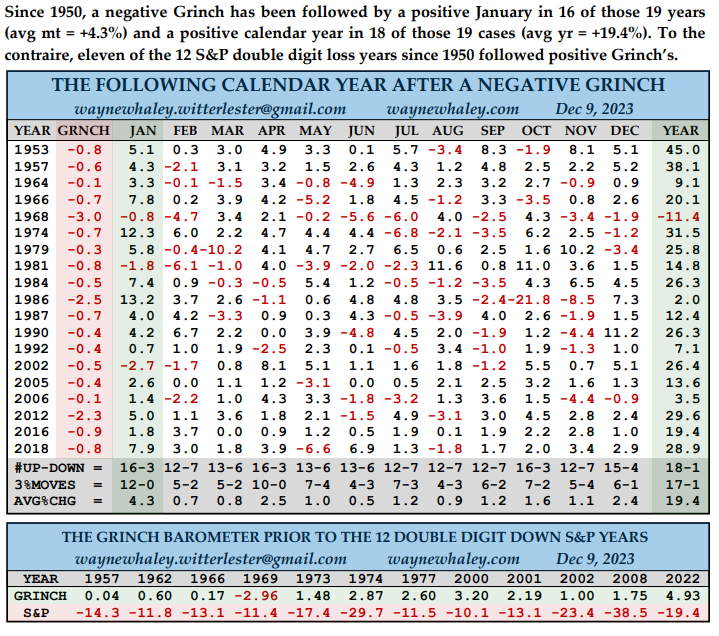
The Three Trading Days Before the Christmas Day Holiday Combined with the Three Trading Days After the Christmas Day Holiday:
If the six trading days mentioned above end up being net positive for the S&P 500 then the year 2024 has an over whelming chance of being a negative year and if the the six trading days mentioned above end up being net negative for the S&P 500 then the year 2024 has an over whelming chance of being a positive year.

Please refer the below chart as provided by WayneWhaley.com:

S&P 500 Grinch Barometer

S&P 500 Grinch Barometer

For more on the above chart and this S&P 500 Christmas Grinch Theory by Wayne Whaley at X / Twitter click here.

To view another theory on the Santa Clause Rally at Trade Currency Now Forex Blog click here.

NOTES ON WHY PAST HISTORY MAY NOT BE A TRUE INDICATOR FOR TODAY’s MARKET: Keep in mind that we are in some unusual financial times with government overreach/market manipulation, hyper inflation, high spending through FED monetary easing and 2024 is a presidential election year on the opposite side we have high debt, highly leveraged markets, wars and attacks and the next pandemic that can crash a market.


I hope the above information was of interest to you.

Anthony at TradeCurrencyNow,
America’s Forex News and Currency Information Source.

The above information is opinion based except where noted. This web page and website information is NOT trading advice. Always contact a licensed professional for information on the above subject or BEFORE applying or practicing the above information.
The Stock Market After Midterm Federal Election

The 2022 federal pre-election situation:
All 435 House of Representative seats were contested in the 2022 Federal USA Midterms Elections. The Democrat Party held an eight-seat majority in the House of Representatives, and therefore the Republicans did not need a major upset to take the House – house of Representative Seats are two year terms. In the then evenly-divided Senate, only 34 regularly scheduled elections of the 100 seats were up for grabs in the 2022 midterms – Senate terms are six years. 21 of those Senate seats in the 2022 Senate election cycle were currently held by Republicans.

The 2022 Federal Election results:
The United States now has a split party Congress.
The House of Representatives 222 Republicans versus 213 Democrats – Republicans gain new majority of the 435 seat House of Representatives (218 seats or more is required for majority control).
The Senate 51 Democrats versus 49 Republicans (51 seats or more are required for majority control).

What does a split party Congress mean for predicting the future stock markets?

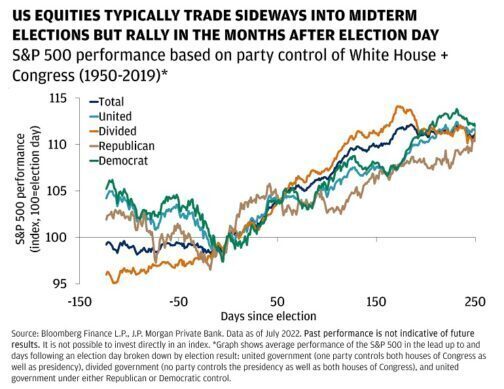
Generally speaking the stock market will rise into a president’s third year in office when there’s a push to stimulate the economy ahead of the next election. The best market stock returns come during this period. For example the S&P 500 rises an average 16% in that third year. In the first six months after a midterm elections, from November to April—the S&P 500 has gained an average of 14.3% and has risen in price 95% of the time.
An election of a Republican Congress with a Democrat president has been the strongest environment for stocks, with the benchmark Standard & Poor’s 500 broad stock market index returning 16.3% on average, annually between 1950 and 2021.
Most data point to an upturn in the S&P 500 after the midterm elections.
-Since 1950, the average return for the S&P 500 in the 12 months after a midterm election is 15%, surprisingly with no down years, John Lynch, Comerica Wealth Management’s chief investment officer, wrote in a report.
-In 17 of the 19 midterms since 1946, stocks performed better in the six months following the election than they did in the six months leading up to it, Liz Ann Sonders, Schwab’s chief investment strategist, said.
-The three quarters from midterms onwards are historically the strongest three quarters, a pattern since 1949, Deutsche Bank says.
– The S&P 500 has in the past outperformed the overall market in the 12-month period after a midterm election, with an average return of 16.3%.

S&P 500 election cycle chart

S&P 500 Midterm Election Cycle Chart

NOTE; a divided government re-enforces the checks and balances government system. A divided government would not likely pass any legislation that falls too far from the center of the political spectrum. This means that major legislative packages aimed at higher taxes for individuals or corporations, for example, would likely be off the table for at least the next two years. However, a divided government would also mean that any fiscal rescue package in the event of an economic downturn would also be less likely.

More on the 2022 Federal Election Results and Election Maps by BBC click here.

More on the 2022 Federal Election Results and Graphs by Forbes click here.

More about how midterm elections affect the stock market by US Wealth Management click here.


I hope the above information was of interest to you.

Anthony at TradeCurrencyNow,
America’s Forex News and Currency Information Source.

The above information is opinion based except where noted. This web page and website information is NOT trading advice. Always contact a licensed professional for information on the above subject or BEFORE applying or practicing the above information.

Where is the Dow Jones Industrial Average Headed?

Two Major Determinators for the Dow Jones Industrial Average Price Fluctuations


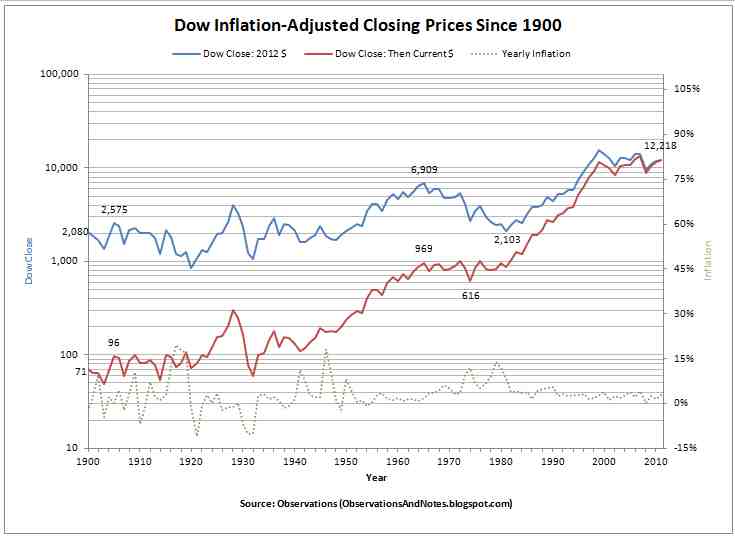
1) Dow Jones Industrial Average versus Inflation
In the old days some people believed the Dow Jones Industrial Average over the long term is directly related to the USA inflation rate and the DJIA would return 1 to 2 percent above the average rate of inflation over the long term.
Let’s take a look at the United States Inflation Rate versus the Dow Jones Industrial Average Index Price.
The Dow Jones Industrial Average:
The DJIA in May 26, 2023 was 33,093.34
The DJIA in December 30, 1960 was 615.89
Over that 63 year period the DJIA rose 32,477.45 That is a 515.52 point average yearly increase of 6,470.0 % or a 8.3% yearly average increase.
NOTE: About 66% of the increase has happened since 2009 low, of 6,547.05, or over the last 24 years of heavy dollar printing or massive FED quantitative Currency Injections.
The USA Inflation Rate:
During the observation period from 1960 into 2023 the average inflation rate was 3.8% per year. Overall, the price increase was 903.96%. An item that cost 100 dollars in 1960 costs 1,003.96 dollars at the beginning of 2023.

What do the above numbers mean for DJIA and inflation; three possible scenario’s may play out: 1) much more inflation is required to support the current Dow Jones Industrial Average OR 2) the Dow Jones Industrial Average needs to drop considerably or 3) a combination of the two.

DJIA and Inflation Chart

Inflation Adjusted Dow Jones Industrial Average Charts click here.
More about the Dow Jones Industrial Average and how it relates to inflation and other measures click here.


2) The Dow Jones Average Portfolio Index Company Stock Replacements and Additions
I look at the Dow Jones Average as more of a Team Index than a Solid Index. What’s the difference; a solid index is an index that the components do not change unless the index is forced to change due to strictly outside forces, a team index is much like a baseball team where the players or company stocks change out. Where the Dow Indexes are concerned the components or stocks may and will change out at the will of the index management or by the indexes’ own rules or definitions.
For example the DJIA covers 30 ‘large cap companies”, which are subject to a criteria and picked by the editors of The Wall Street Journal.
Over the years the companies in the index have been changed to ensure the index stays relatively current in its measure of the U.S. economy.
Charles Dow first published the Dow Jones Industrial Average on May 26, 1896. On this day, the Dow consisted of only 12 companies. Of special note; only one of the initial companies included in the average remain – yes, you read that correctly. Currently, General Electric holds the longest listed Dow Jones Industrial Average Index / DJIA Company.
One can easily see that if the original 12 companies were still in the Dow Jones Industrial Average Index / DJIA today the index would be worth practically zero!!!
The original Dow Jones Industrial Average Index 12 companies:
American Cotton Oil
American Sugar
American Tobacco
Chicago Gas
Distilling & Cattle Feeding
General Electric
Laclede Gas
National Lead
North American
Tennessee Coal and Iron
U.S. Leather
U.S. Rubber
Therefore; changing out the companies does have a direct reflect on the Dow Jones Industrial Average price.
This is why a person who trades Dow Jones Industrial Average 30 as a group may need to be aware of the above company stock change outs or added companies to the Dow Jones Industrial Average.
NOTE: On August 24, 2020, three companies were replaced on the Dow Jones Industrial Average Index / DJIA, the companies Salesforce, Amgen and Honeywell were added to the Dow, replacing Exxon-Mobil, Pfizer, and Raytheon Technologies.
2020 Companies in the Dow
Below is a list of the companies included in the Dow as of September 2020.
Salesforce
Procter & Gamble
DowDuPont
Amgen
3M
IBM
Merck
American Express
McDonald’s
Boeing
Coca-Cola
Caterpillar
JPMorgan Chase
Walt Disney
Johnson & Johnson
Walmart
Home Depot
Intel
Microsoft
Honeywell
Verizon
Chevron
Cisco Systems
Travelers Cos.
UnitedHealth Group
Goldman Sachs
Nike
Visa
Apple
Walgreens Boots Alliance

More about the DOW click here.


I hope the above information was of interest to you.

Anthony at TradeCurrencyNow,
America’s Forex News and Currency Information Source.

The above information is opinion based except where noted. This web page and website information is NOT trading advice. Always contact a licensed professional for information on the above subject or BEFORE applying or practicing the above information.

What is the Difference Between Investing and Speculating ?

Benjamin Graham defined speculation in his classic book, The Intelligent Investor, as primarily “anticipating and profiting from market fluctuations.”
He defined investing as “acquiring and holding suitable securities at suitable prices.” When it comes to investing, valuation always matters.

The FaceBook IPO has been a good example of “The Difference Between Investing and Speculating”

Speculating

Consider a volatile junior gold mining company that has an equal chance over the near term of skyrocketing from a new gold mine discovery or going bankrupt. With no news from the company, investors would tend to shy away from such a risky trade, but some speculators may believe that the junior gold mining company is going to strike gold and may buy its stock on a hunch. Speculators look for a high return on a spec investment.
Many speculative investors will buy several companies in a growth field and hope that one or two pay off big in order to cover the losses of the companies that fail to produce a profit.

Investing

Consider a large stable multinational company. The company may pay a consistent dividend that increases annually, and its business risk is low. An investor may choose to invest in this company over the long-term to make a pre-determined satisfactory return on his or her capital while taking on relatively low risk. Additionally, the investor may add several similar companies across different industries to his or her portfolio to diversify and further lower their risk.

I hope the above trading information was of help to you.

Anthony DiChi at TradeCurrencyNow,
America’s Forex News and currency information source.

FaceBook Value and Speculation or Investment ?

I’m not one to usually comment on an individual stock but so many have asked about FaceBook that I feel compelled to contribute my view.

1) Is FaceBook Growing? The only figures I’ve heard for months is the 900 million users number. Therefore there has been very little, if any, increase in month over month FaceBook users.
This is a red flag!

2) What is a FaceBook User? Based on current information a FaceBook user is someone who has a FaceBook account. Let’s keep in mind that it is almost impossible to close a FaceBook account. Therefore; out of the 900 million users 200 million are basically non-functioning accounts.
NEW TOTAL 700 million users.

3) Let us also figure that one person can and usually does have more than one account. Therefore; out of the 700 million users 200 (account holders) million users have two accounts.
NEW TOTAL 500 million users.

4) Now lets look at what reality can define as an active user. An active user can be defined as signing into their FaceBook account more than once per week. Therefore; out of the 500 million users or account holders there are 200 million users who do not sign into their FaceBook account more than once a week. Now we are down to 300 million active users.
NEW TOTAL 300 million users.

5) What FaceBook wants you to believe;
900 million users dived into 100 billion dollar stock offering equals about 1,111 dollars per user.

6) Now let us use the 300 million ACTIVE FaceBook users;
300 million users into 100 billion dollar stock offering equals about 3,333 dollars per user.

You can see how the actual price paid per active user triples from $1,111 to $3,333.

Let us also consider the fact that the major owner and CEO of the company never really wanted to let his GROWING company go public. Then one day he woke up and said “I want to go public”. No he did not. He and his consultants and board members said “our growth has stalled and now is the the time to go public”.

What FaceBook did was offer to the public the next two to three years of POTENTIAL growth.
In other words purchasers of FaceBook shares just paid what the company may be worth in 2015. That is a three year wait and see investment at future par value.

Therefore one might believe that a current investment in FaceBook is speculation and not an investment.

Does FaceBook have the potential to monetize and become a major player? My view is that it is surely possible but the road ahead has several major turns (generating a profit) and unpredictable storms (competition) in it’s path.

This link added on 5-25-12 “5 signs Facebook hates its shareholders”

This link added on 6-13-12 What Facebook Stock Is Worth?

I hope the above trading information was of help to you.

Anthony DiChi at TradeCurrencyNow,
America’s Forex News and currency information source.

How to Avoid the 6 Traits of Forex Market Fools

The Below was sent to me from Jack Crooks of MoneyandMarkets.com I thought it was a good read for forex traders.

Traits we all exhibit at times are what swiftly separates us from our money — traits of an “acute successful randomness fool,” as defined by Nassim Taleb, author of the excellent book, Fooled by Randomness.

Today, I’d like to examine these common traits. Because if you can identify and recognize the traits of fool, and apply some simple principles, you’ll have your own built-in risk management system in place.

Keep in mind, though, that even some of the best traders in the world are prone to these mistakes, as we see so often in the blow up of funds and firms. So if it can happen to the pros, it can happen to you.

After each of the traits of market fools I provide an example that perhaps you can all relate to, and a reality bite to show the proper perspective and simple ways to avoid these mistakes.

Trait #1 — An overestimation of the accuracy of their beliefs in some measure, either economic or statistical

Example: The U.S. dollar MUST fall because the current U.S. account deficit is rising. Reality: No it doesn’t have to fall. If money pours into the United States from international investors for whatever reason (stocks, high yield deposits, real property, etc.) the dollar will rise regardless of what the current account deficit does. Develop reasons, but don’t be dogmatic.

Trait #2 — A tendency to get married to positions

Example: The dollar sold off even though the jobs report said employment is strong. I’m right, the market is wrong. Reality: It’s always about price action. There is much going on in the market, and a lot we will never know about. Price action tells us that our reasons may be wrong, no matter how much evidence we gather. Listen to the market. It’s your only master.

Trait #3 — The tendency to change their story

Example: You are a short-term trader and the market just moved against you on a key daily report. You rationalize that it’s okay, because “I’m in this trade for the long haul, and sooner or later I will be right.” Reality: If you develop reasons and time frames, stick with them. If the market gives you information that says your view is wrong, get out! You can always re-enter. Getting out will at least give you an opportunity to more objectively evaluate new information.

Trait #4 — No precise game plan ahead of time as to what to do in the event of losses

Example: You enter the trade thinking you’re going to make big money — all you think about is your reward. Reality: You should always think of your risk before you enter a position — that’s what professional traders and speculators do. You must consider your risk beforehand because if you wait until you have already taken a position, you tend to lose your objectivity.

Trait #5 — Absence of critical thinking expressed in absence of a “stop loss”

Example: You liked owning the euro when it was at $1.40 against the dollar, you will love it at $1.35 — the average down mentality. Reality: This goes to point number 4 above; set your risk parameters ahead of time by establishing a stop-loss level to exit a trade and stick with it — don’t rationalize. The euro at $1.35 may indeed prove to be a bargain. But it may also be the start of a major decline that can significantly damage your capital or wipe you out if you are trading with high leverage.

Trait #6 — Denial
Example: Well, I really got hosed on that trade — it was bad luck. Reality: There is usually a very good reason why you lose money. Take the time to try to understand it. You learn more by objectively analyzing your investment mistakes than you do by studying your winners.

The bottom line of all this is that you can never keep from being fooled by the market. But you can control your risk. And if you can control your risk and stay in the game to fight another day, your chances of winning will increase dramatically.

Click here to read more…..

Click here to find out more about Jack Crooks from Money and Markets

Anthony DiChi,
Your friend in Forex Currency Trading, FX Information and Forex News at TradeCurrencyNow

The World Forex Economic Game and why the USA might be in a better position then most know!

I believe it was a United States General that once said “in China they play chess…in America we play poker”.

You ask, what does chess and poker have to do with the Forex Market or world economics or even world power? It has just about everything to do with it when the USA is involved.

You see when one plays poker it helps to have deep pockets and it also helps to know what your opponent’s next basic move will be (in chess there are so few forward moves). The USA has the deep pockets and the willingness to sacrifice a big chunk of their assets if need be or pass up taking profits just to throw the others players off balance.

Right now we are witnessing the largest economic poker/chess game in the history of mankind.

China has been running full out since 2008 (since the USA’s economic slowdown) self capitalizing it’s own economy to pick up the slack of falling exports to the USA and Europe. China, much like the USA did, is suffering a major real estate bubble (especially inland China). And much like the USA the Chinese Government has been pumping billions of dollars into it’s domestic economy. Unlike the USA the Chinese economy has yet to break.

The USA play is to collapse it’s economy first and start rebuilding (which it did) while the other economies (players) in the world begin to falter or have yet to falter. This way the USA will be in a strong position to pick up the world economic pieces at relatively bargain basement prices.

It is in my opinion that the main reason TARP funding was used back in 2009 was to save financially crippled American companies from being purchased at fire sale prices. The same goes for the US Government propping up the stock market. Many exchange listed American companies’ stock prices in March 2008 were ripe for foreign takeover. Not to mention the fact that government and pensions plans are some of the single largest holders of stock.

So when China implodes watch for falling commodity prices (not so much food) and many of the foreign companies that China paid top dollar for may be available at fire sale prices. All this will be happening as the US dollar gains ground. That’s right, the US dollar will be worth more. With China and Europe falling apart the good old Yankee dollar should once again prevail.

Video on China – Europe (added on 11-13-11)

China’s Bad Growth Bet (added on 11-14-11)

That trillion US dollars that China is sitting on, they will need it to help jump start their economy after it implodes to stop their people from overthrowing the current Chinese government.

The ten trillion dollars the US Government has in circulation (much of it put into circulation over the last three years) no worries. The US dollar continues to be the reserve currency and with many third world nations and developing nations on their way up the economic ladder the dollars will be needed. Availability of a reserve currency is almost as important as it’s strength.

I hope the above currency trading article was of help to you.

Below link ADDED on 3-24-2012
Why the U.S. dollar may be in a sweet spot … a place it hasn’t been for a long time.

Anthony DiChi at TradeCurrencyNow,
America’s Forex News and currency information source.

Is The More Complex Forex Strategy the Better Trading Strategy

Traders often begin with a simple strategy, and see a small return. They then assume that if they continue to tweak their system, taking into account a few more variables, that they will increase their returns. This is not usually the case. Instead of looking at simple things such as price movement (which is the final determinate in making a profit) and whether the market is trending or ranging, the trader attempts to determine exact reversal points and make more trades. Trading profits are made at the margin – even the best traders only win slightly more than they lose. Therefore, if a system makes money, stick with it and don’t change it; focus on money management instead.

For more on this topic go to: http://www.investopedia.com/articles/forex/11/ten-forex-myths.asp?partner=fxweekly6#ixzz1QIGaqKWP

Anthony DiChi at TradeCurrencyNow,
America’s Forex News and currency information source.

Question and Answer Blog Page

Please feel free to ask a question or answer a question about Currency Trading on the FX Forex Market.

Anthony DiChi at TradeCurrencyNow,
America’s Forex News and currency information source.