How Stocks Perform With or Without Santa Showing Up

The Santa Claus Rally historically usually delivers strong market returns during such a short time frame (from 12-22-23 and ends on the second trading day of January):
As highlighted in the chart below, the S&P 500 has generated average and median returns of 1.3% during the Santa Claus Rally period, compared to only 0.2% and 0.4% average and median returns for all rolling seven-day returns, respectively.
Please refer to the below Santa Clause Rally History bar chart as sourced at LPL Research, Bloomberg 12/22/23.

Source: LPL Research, Bloomberg 12/22/23

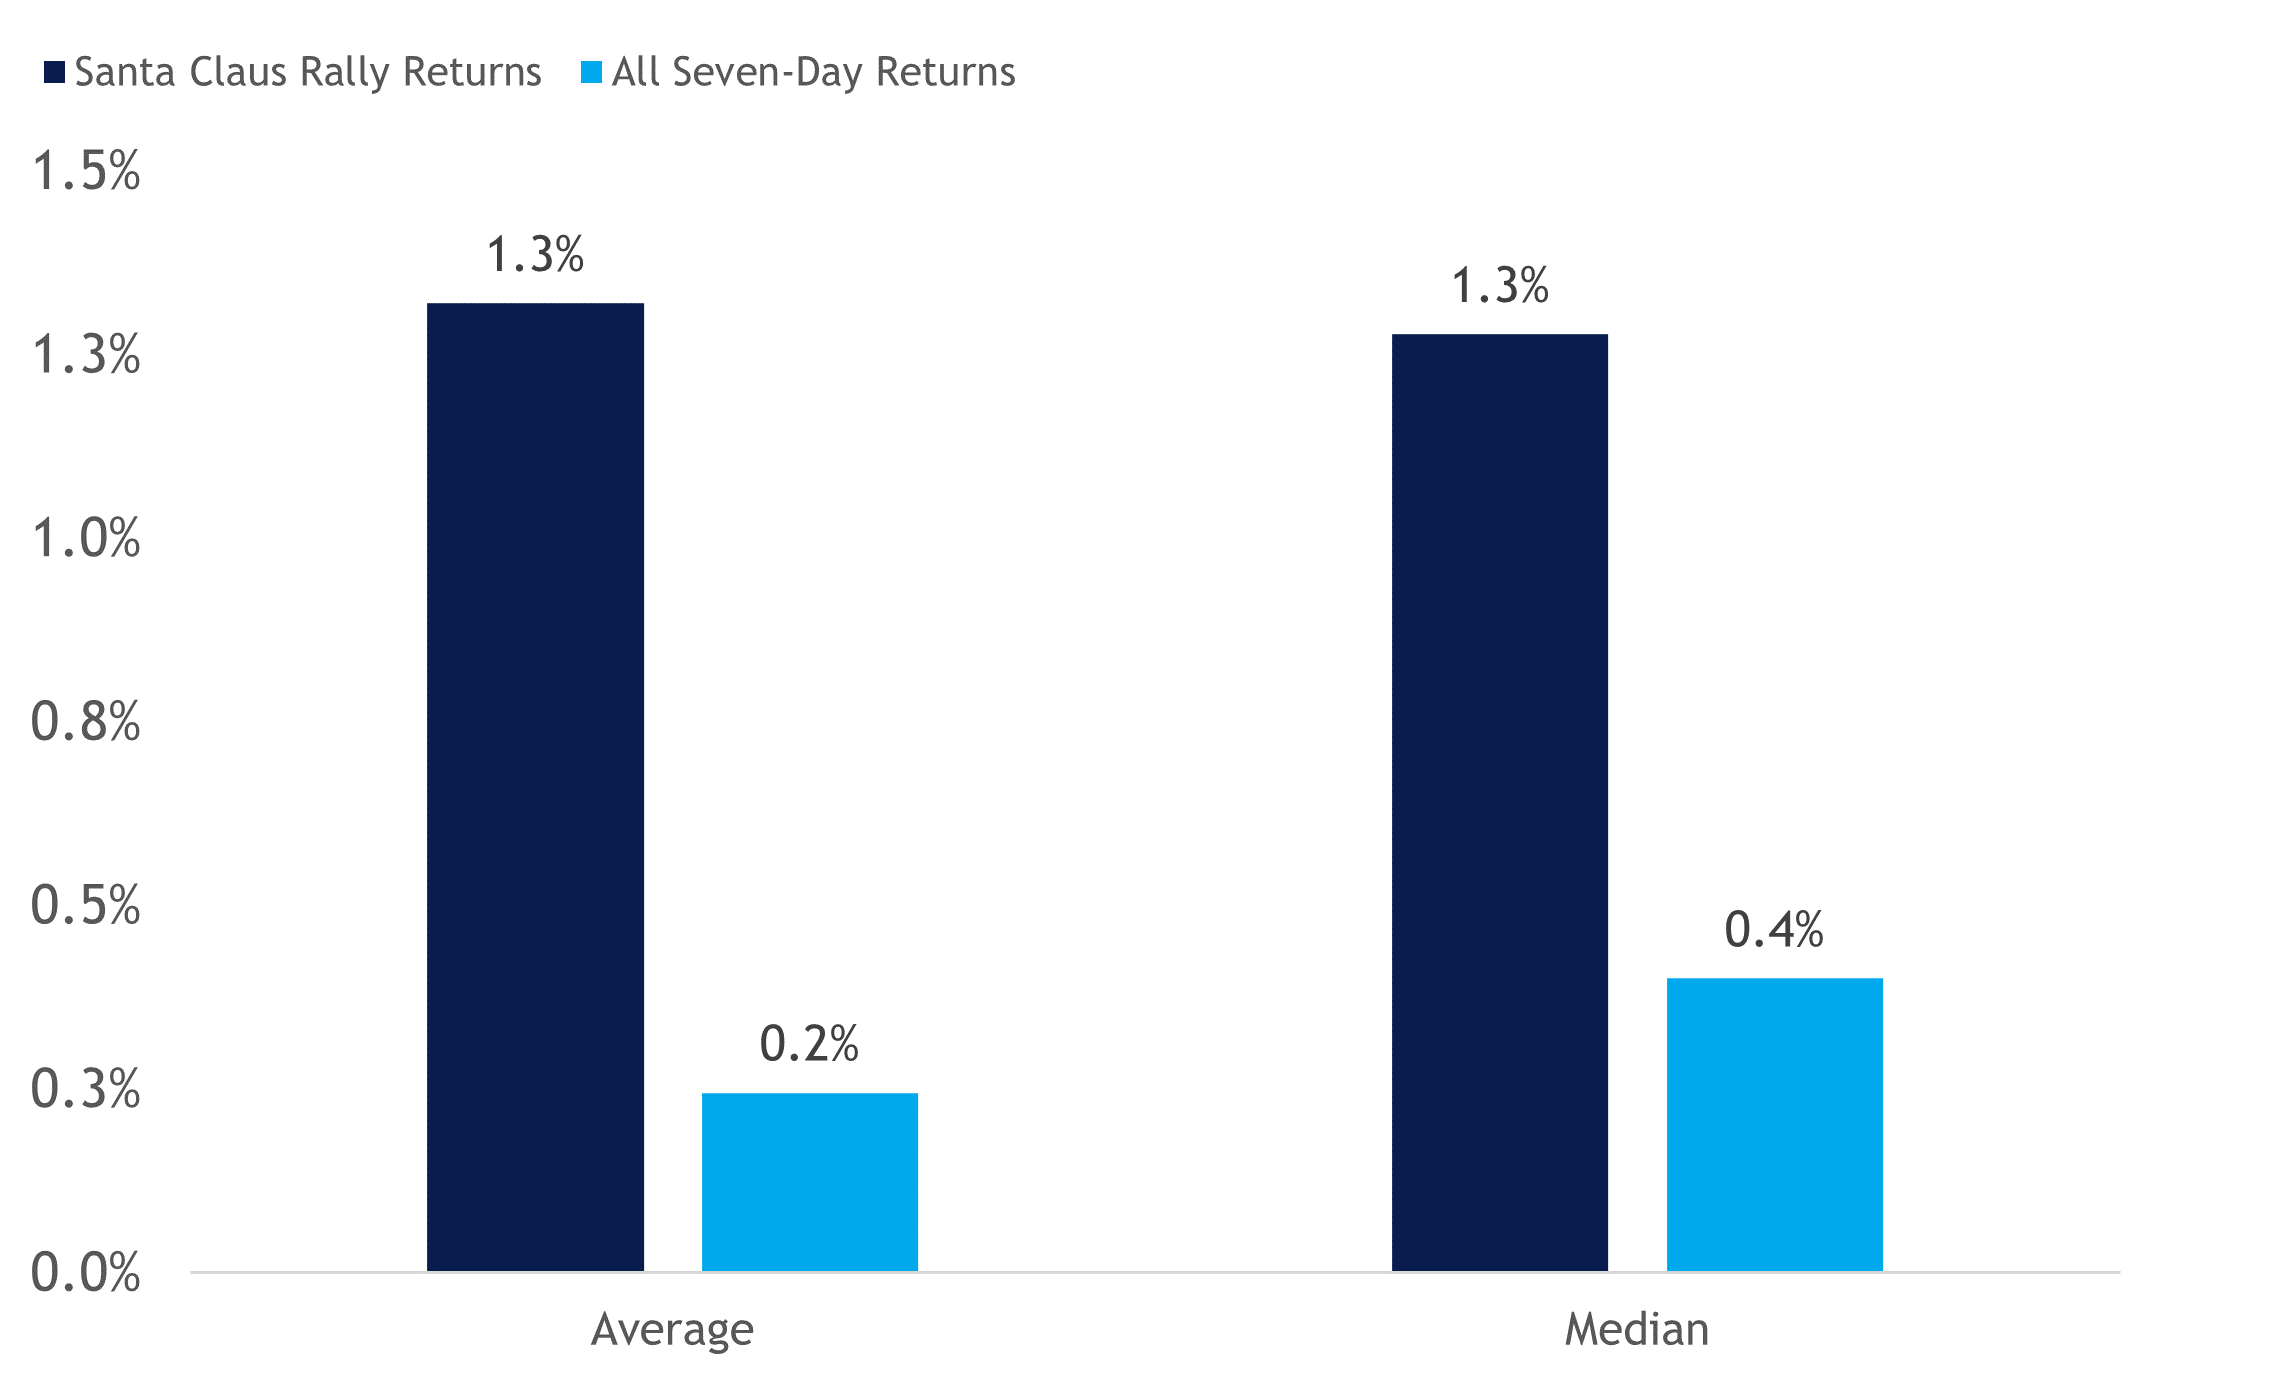
The Santa Claus Rally Historically Delivers Above-Average Gains

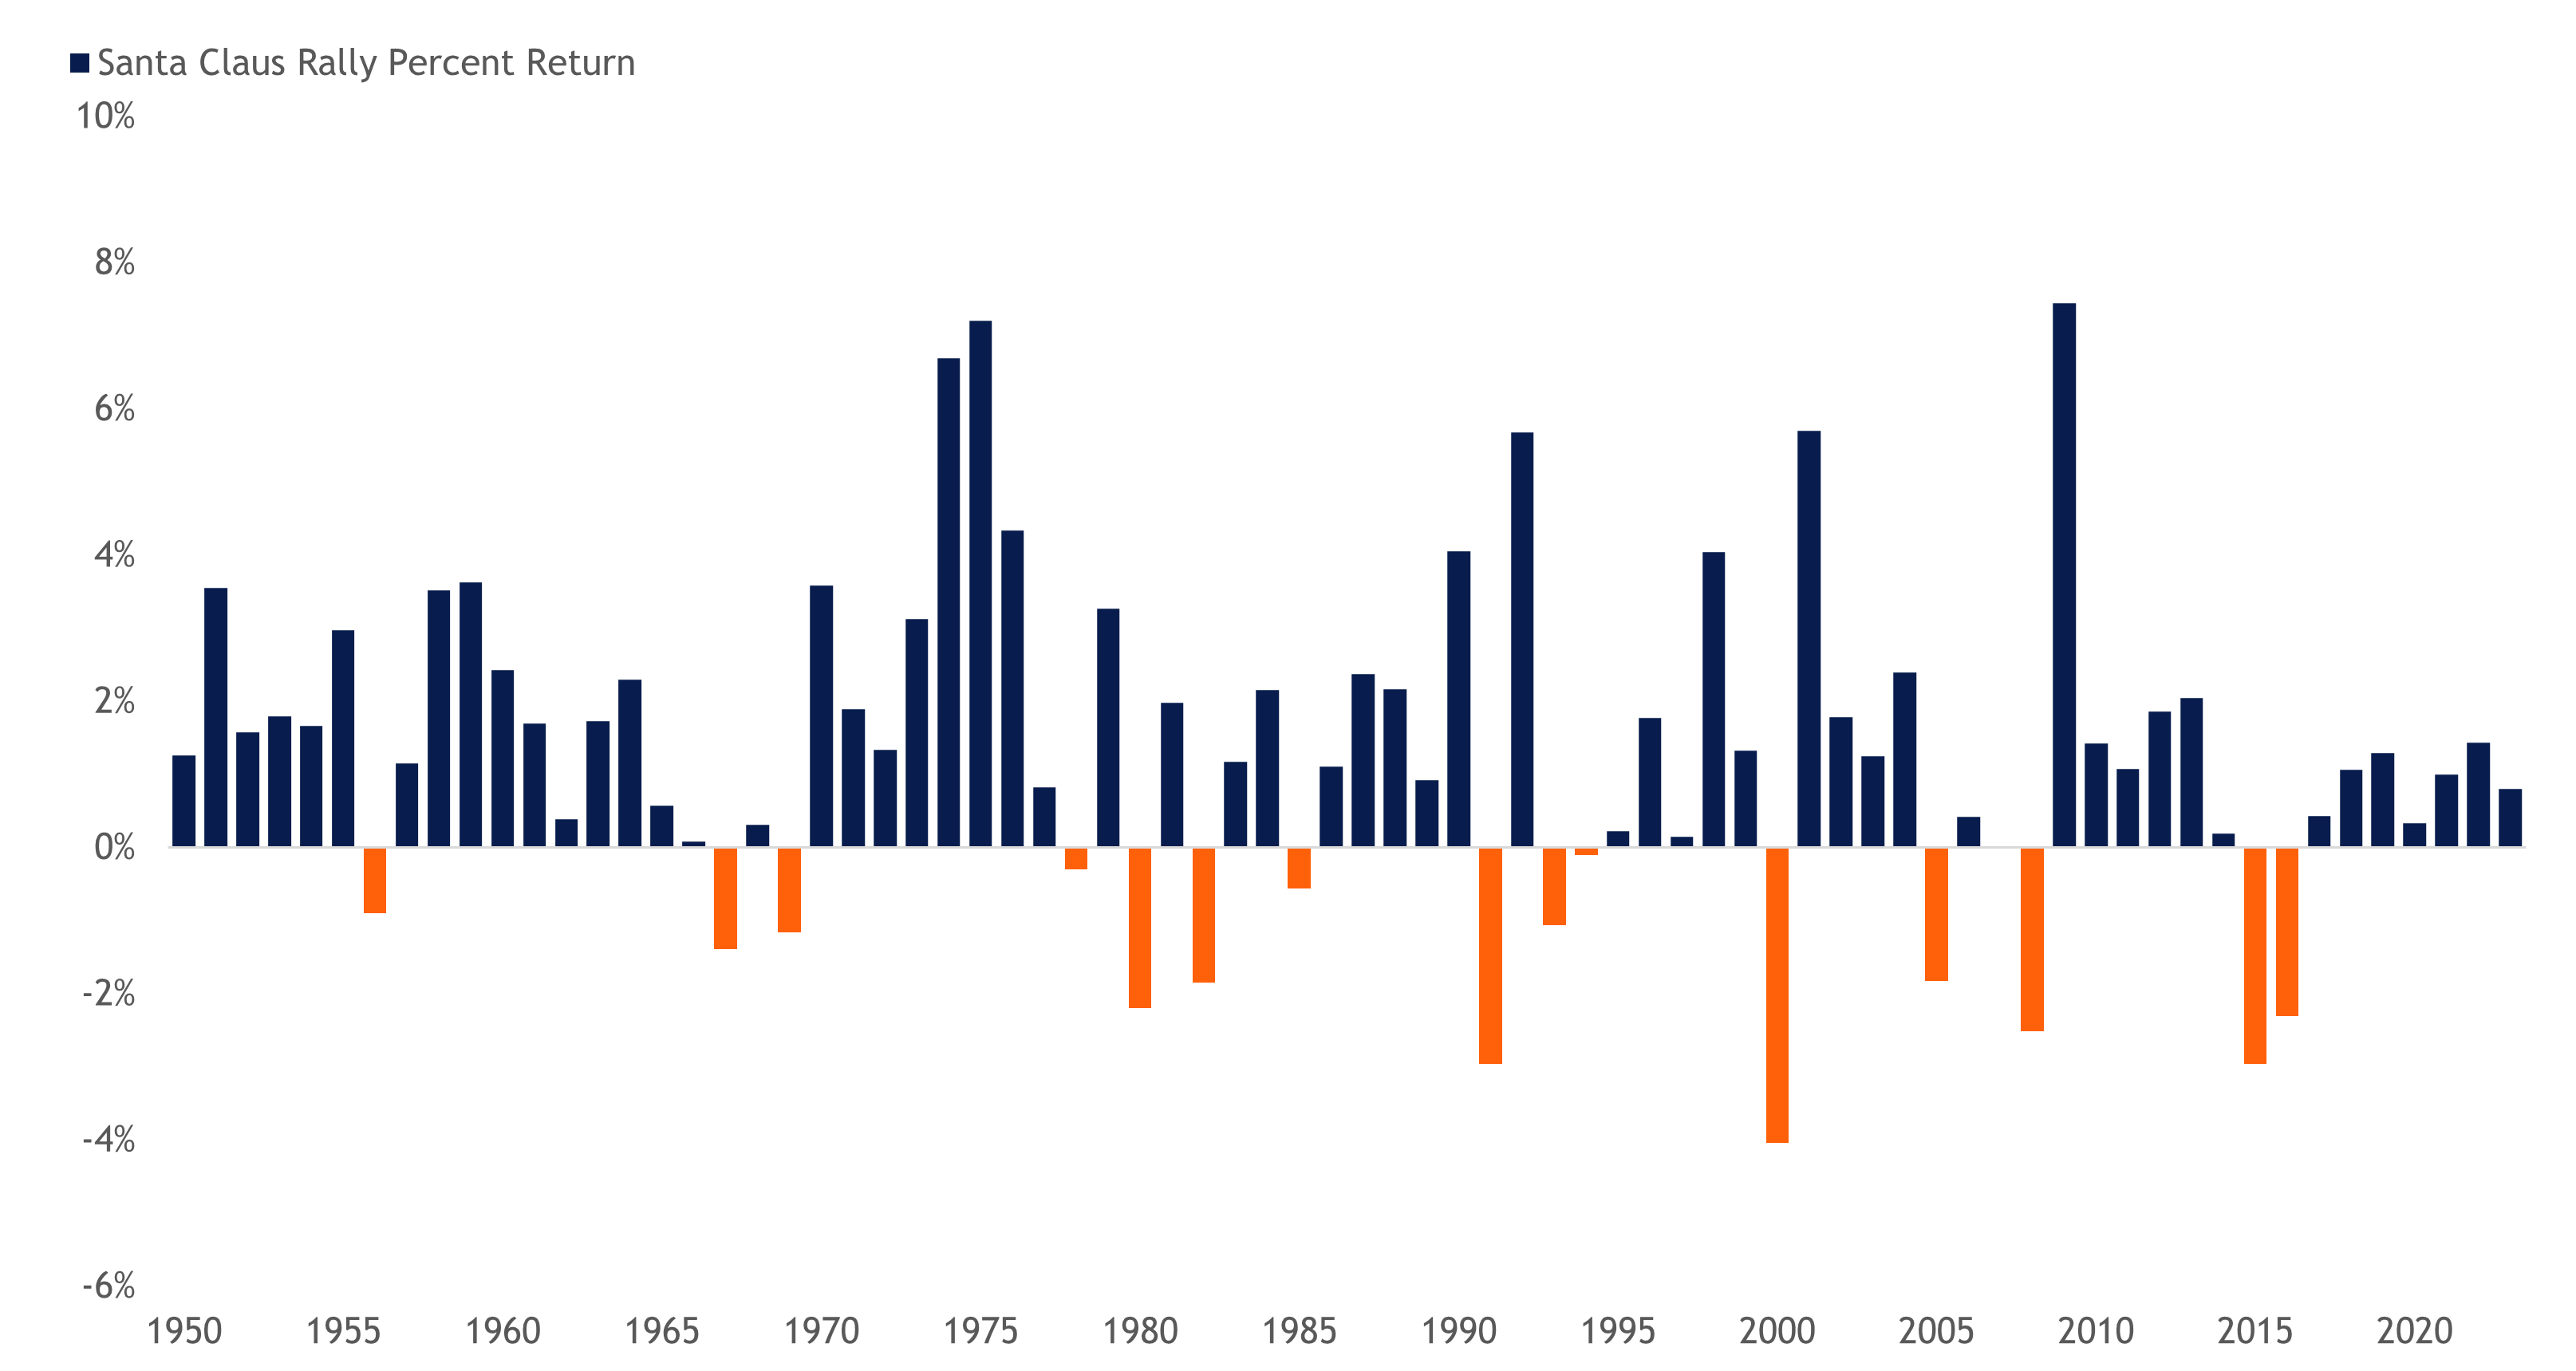
When the S&P 500 finishes higher during this year’s Santa Claus Rally, it will mark the eighth consecutive period of positive returns. The longest streak was 10 back in the mid-1960s. However, as highlighted in the table below, positive returns during the Santa Claus Rally are relatively common, as the market has advanced 80% of the time during this period. All rolling seven-day returns for the S&P 500 since 1950 have a positivity rate of only 58%.
Please refer to the below Santa Clause Rally Chart as sourced at LPL Research, Bloomberg 12/22/23.

S&P 500 Santa Claus Rally Returns by Year from 1950 through to 2022

Source: LPL Research, Bloomberg 12/22/23

How Stocks Perform With or Without Santa Showing Up

For more on the above chart and this Santa Clause Rally Theory by LPL Financial click here.

To view another theory on the Santa Clause Rally at Trade Currency Now Forex Blog click here.

NOTES ON WHY PAST HISTORY MAY NOT BE A TRUE INDICATOR FOR TODAY’s MARKET: Keep in mind that we are in some unusual financial times with government overreach/market manipulation, hyper inflation, high spending through FED monetary easing and 2024 is a presidential election year on the opposite side we have high debt, highly leveraged markets, wars and attacks and the next pandemic that can crash a market.


I hope the above information was of interest to you.

Anthony at TradeCurrencyNow,
America’s Forex News and Currency Information Source.

The above information is opinion based except where noted. This web page and website information is NOT trading advice. Always contact a licensed professional for information on the above subject or BEFORE applying or practicing the above information.

S&P 500 Positive Christmas or Negative Christmas History – Grinch Indicator

The Three Trading Days Before the Christmas Day Holiday Combined with the Three Trading Days After the Christmas Day Holiday:
If the six trading days mentioned above end up being net positive for the S&P 500 then the year 2024 has an over whelming chance of being a negative year and if the the six trading days mentioned above end up being net negative for the S&P 500 then the year 2024 has an over whelming chance of being a positive year.

Please refer the below chart as provided by WayneWhaley.com:

S&P 500 Grinch Barometer

S&P 500 Grinch Barometer

For more on the above chart and this S&P 500 Christmas Grinch Theory by Wayne Whaley at X / Twitter click here.

To view another theory on the Santa Clause Rally at Trade Currency Now Forex Blog click here.

NOTES ON WHY PAST HISTORY MAY NOT BE A TRUE INDICATOR FOR TODAY’s MARKET: Keep in mind that we are in some unusual financial times with government overreach/market manipulation, hyper inflation, high spending through FED monetary easing and 2024 is a presidential election year on the opposite side we have high debt, highly leveraged markets, wars and attacks and the next pandemic that can crash a market.


I hope the above information was of interest to you.

Anthony at TradeCurrencyNow,
America’s Forex News and Currency Information Source.

The above information is opinion based except where noted. This web page and website information is NOT trading advice. Always contact a licensed professional for information on the above subject or BEFORE applying or practicing the above information.

The Stock Market After Midterm Federal Election

The 2022 federal pre-election situation:
All 435 House of Representative seats were contested in the 2022 Federal USA Midterms Elections. The Democrat Party held an eight-seat majority in the House of Representatives, and therefore the Republicans did not need a major upset to take the House – house of Representative Seats are two year terms. In the then evenly-divided Senate, only 34 regularly scheduled elections of the 100 seats were up for grabs in the 2022 midterms – Senate terms are six years. 21 of those Senate seats in the 2022 Senate election cycle were currently held by Republicans.

The 2022 Federal Election results:
The United States now has a split party Congress.
The House of Representatives 222 Republicans versus 213 Democrats – Republicans gain new majority of the 435 seat House of Representatives (218 seats or more is required for majority control).
The Senate 51 Democrats versus 49 Republicans (51 seats or more are required for majority control).

What does a split party Congress mean for predicting the future stock markets?

Generally speaking the stock market will rise into a president’s third year in office when there’s a push to stimulate the economy ahead of the next election. The best market stock returns come during this period. For example the S&P 500 rises an average 16% in that third year. In the first six months after a midterm elections, from November to April—the S&P 500 has gained an average of 14.3% and has risen in price 95% of the time.
An election of a Republican Congress with a Democrat president has been the strongest environment for stocks, with the benchmark Standard & Poor’s 500 broad stock market index returning 16.3% on average, annually between 1950 and 2021.
Most data point to an upturn in the S&P 500 after the midterm elections.
-Since 1950, the average return for the S&P 500 in the 12 months after a midterm election is 15%, surprisingly with no down years, John Lynch, Comerica Wealth Management’s chief investment officer, wrote in a report.
-In 17 of the 19 midterms since 1946, stocks performed better in the six months following the election than they did in the six months leading up to it, Liz Ann Sonders, Schwab’s chief investment strategist, said.
-The three quarters from midterms onwards are historically the strongest three quarters, a pattern since 1949, Deutsche Bank says.
– The S&P 500 has in the past outperformed the overall market in the 12-month period after a midterm election, with an average return of 16.3%.

S&P 500 election cycle chart

S&P 500 Midterm Election Cycle Chart

NOTE; a divided government re-enforces the checks and balances government system. A divided government would not likely pass any legislation that falls too far from the center of the political spectrum. This means that major legislative packages aimed at higher taxes for individuals or corporations, for example, would likely be off the table for at least the next two years. However, a divided government would also mean that any fiscal rescue package in the event of an economic downturn would also be less likely.

More on the 2022 Federal Election Results and Election Maps by BBC click here.

More on the 2022 Federal Election Results and Graphs by Forbes click here.

More about how midterm elections affect the stock market by US Wealth Management click here.


I hope the above information was of interest to you.

Anthony at TradeCurrencyNow,
America’s Forex News and Currency Information Source.

The above information is opinion based except where noted. This web page and website information is NOT trading advice. Always contact a licensed professional for information on the above subject or BEFORE applying or practicing the above information.

Where is the Dow Jones Industrial Average Headed?

Two Major Determinators for the Dow Jones Industrial Average Price Fluctuations


1) Dow Jones Industrial Average versus Inflation
In the old days some people believed the Dow Jones Industrial Average over the long term is directly related to the USA inflation rate and the DJIA would return 1 to 2 percent above the average rate of inflation over the long term.
Let’s take a look at the United States Inflation Rate versus the Dow Jones Industrial Average Index Price.
The Dow Jones Industrial Average:
The DJIA in May 26, 2023 was 33,093.34
The DJIA in December 30, 1960 was 615.89
Over that 63 year period the DJIA rose 32,477.45 That is a 515.52 point average yearly increase of 6,470.0 % or a 8.3% yearly average increase.
NOTE: About 66% of the increase has happened since 2009 low, of 6,547.05, or over the last 24 years of heavy dollar printing or massive FED quantitative Currency Injections.
The USA Inflation Rate:
During the observation period from 1960 into 2023 the average inflation rate was 3.8% per year. Overall, the price increase was 903.96%. An item that cost 100 dollars in 1960 costs 1,003.96 dollars at the beginning of 2023.

What do the above numbers mean for DJIA and inflation; three possible scenario’s may play out: 1) much more inflation is required to support the current Dow Jones Industrial Average OR 2) the Dow Jones Industrial Average needs to drop considerably or 3) a combination of the two.

DJIA and Inflation Chart

Inflation Adjusted Dow Jones Industrial Average Charts click here.
More about the Dow Jones Industrial Average and how it relates to inflation and other measures click here.


2) The Dow Jones Average Portfolio Index Company Stock Replacements and Additions
I look at the Dow Jones Average as more of a Team Index than a Solid Index. What’s the difference; a solid index is an index that the components do not change unless the index is forced to change due to strictly outside forces, a team index is much like a baseball team where the players or company stocks change out. Where the Dow Indexes are concerned the components or stocks may and will change out at the will of the index management or by the indexes’ own rules or definitions.
For example the DJIA covers 30 ‘large cap companies”, which are subject to a criteria and picked by the editors of The Wall Street Journal.
Over the years the companies in the index have been changed to ensure the index stays relatively current in its measure of the U.S. economy.
Charles Dow first published the Dow Jones Industrial Average on May 26, 1896. On this day, the Dow consisted of only 12 companies. Of special note; only one of the initial companies included in the average remain – yes, you read that correctly. Currently, General Electric holds the longest listed Dow Jones Industrial Average Index / DJIA Company.
One can easily see that if the original 12 companies were still in the Dow Jones Industrial Average Index / DJIA today the index would be worth practically zero!!!
The original Dow Jones Industrial Average Index 12 companies:
American Cotton Oil
American Sugar
American Tobacco
Chicago Gas
Distilling & Cattle Feeding
General Electric
Laclede Gas
National Lead
North American
Tennessee Coal and Iron
U.S. Leather
U.S. Rubber
Therefore; changing out the companies does have a direct reflect on the Dow Jones Industrial Average price.
This is why a person who trades Dow Jones Industrial Average 30 as a group may need to be aware of the above company stock change outs or added companies to the Dow Jones Industrial Average.
NOTE: On August 24, 2020, three companies were replaced on the Dow Jones Industrial Average Index / DJIA, the companies Salesforce, Amgen and Honeywell were added to the Dow, replacing Exxon-Mobil, Pfizer, and Raytheon Technologies.
2020 Companies in the Dow
Below is a list of the companies included in the Dow as of September 2020.
Salesforce
Procter & Gamble
DowDuPont
Amgen
3M
IBM
Merck
American Express
McDonald’s
Boeing
Coca-Cola
Caterpillar
JPMorgan Chase
Walt Disney
Johnson & Johnson
Walmart
Home Depot
Intel
Microsoft
Honeywell
Verizon
Chevron
Cisco Systems
Travelers Cos.
UnitedHealth Group
Goldman Sachs
Nike
Visa
Apple
Walgreens Boots Alliance

More about the DOW click here.


I hope the above information was of interest to you.

Anthony at TradeCurrencyNow,
America’s Forex News and Currency Information Source.

The above information is opinion based except where noted. This web page and website information is NOT trading advice. Always contact a licensed professional for information on the above subject or BEFORE applying or practicing the above information.

Rumors Surfacing About the Death of The US Dollar

As written by Sandy Franks of thewomensfinancialalliance.com

The U.S. dollar (USD) has been the world’s global reserve currency for over 70 years. It was given this elite status at the Bretton Woods Conference in 1944; otherwise known as the United Nations Monetary and Financial Conference.

At this conference 44 nations gathered together from July 1 to 22 in Bretton Woods New Hampshire. Their goal was to agree upon new rules for the post-WWII global monetary system.

The amount of debt England incurred during the war forced it to pass the global reserve currency status over to the United States

Why does having this status matter?

Being given this status allows a currency to be worth much, much more than any other country’s currency. A large part of having a global reserve currency is your currency becomes global in demand.

It is the international baseline currency for all trade. Countries are agreeing, in principle, to trade with your currency. Currently about 20 currencies peg their currencies to the dollar. Doing so, gives other countries a powerful medium of exchange.

six latest reserve currency countries

Six Latest Reserve Currency Countries

However, many countries, especially in East Asia, have stopped using the U.S. dollar for trading purposes.

Instead they are using “bilateral trade agreements” and they’re becoming popular these days. That’s prompted rumors that the U.S. dollar’s rein as “supreme currency” could soon come to an end.

Is this possible? Minneapolis Federal Reserve President Neel Kashkari said it’s possible the dollar could loose its status as the world’s reserve currency during his lifetime.

Let’s explore some of the challenges the U.S. faces in retaining this title.

Debt: Everyone knows that the U.S. has a debt problem. In fact, we’ve always had debt. In 1860, America’s debt was $65 million. The Civil War brought about a major spike in the debt. World War I and World War II also brought about major rises in the debt.

Although the amount has fluctuated, in recent years it has skyrocketed. We are now swimming in $19 trillion in national debt.

The U.S. owes almost US $3 trillion to just Japan and China alone. And regardless of whether Trump or Clinton wins the next election, the debt will only continue to grow.

Value of the Dollar: The value of the U.S. dollar has been in a downtrend for the last 31 years. The U.S. dollar index, which compares the greenback to the euro, yen, pound sterling, krona, franc, and Canadian dollar, has been trending lower since 1985.

Only over the past two years has the U.S. dollar increased in value relative to other major currencies. That’s not because the U.S. economy is doing so well; it’s that the other economies are doing worse.

Too Many Dollars: Another problem facing the U.S. dollar is that there is too much of it in circulation. The money supply started to increase in 1984; at the same time the value of the U.S. dollar started to decline against other world currencies.

To stimulate the economy following the Credit Crisis of 2008, the Federal Reserve announced three rounds of Quantitative Easing, a monetary policy that created trillions of dollars in new paper money.

Throughout history, countries that have continued printing more of their money eventually saw the value of that money collapse.

Negative Trade Balance: The U.S. has not had a positive balance of trade (exports minus imports) since 1976. That means since 1976 other countries have been exporting goods and services to us and we have been exporting our currency to them in return.

So if countries decided against the U.S. dollar as the reserve currency, what would they use instead?

Central bankers throughout the world, from Canada to Ireland, have recently suggested that they might issue a digital currency in the future.

There’s also the possibility of using the Chinese Yuan, also known as the Renminbi as the worlds’ reserve currency. Countries are trading so much Yuan that it has become the second most used currency in the world, passing the EURO in 2013.

If the USD is replaced, what happens to the U.S. economy? Without demand for the dollar, the end result would be a major currency devaluation and probably a drastic standard of living adjustment.

Could this actually happen? Anything is possible. These rumors have been around for a while but in recent years, they are getting louder and louder.


I hope the above forex currency trading information was of help to you.

Anthony at TradeCurrencyNow,
America’s Forex News and Currency Information source.

The above information is opinion based except where noted. Always contact a licensed professional for information on the above subject or BEFORE applying or practicing the above information.

Is Small Investor Money and Capital Getting Tight?

As reported by Brian Chappatta at Bloomberg.com

The municipal-bond market is forcing high-yield borrowers to scrap their junk.

The Florida Development Finance Corp. this week postponed a $1.75 billion unrated bond sale for All Aboard Florida, a passenger railroad backed by Fortress Investment Group LLC, that underwriters have been marketing since August. A Texas agency has delayed pricing $1.4 billion of speculative debt for a methanol plant since releasing offering documents Oct. 19. And the Puerto Rico Aqueduct & Sewer Authority, struggling to access capital as the island staggers toward default, couldn’t lure buyers even with yields of 10 percent.

The struggle to sell the munis mirrors the slowdown in the corporate-debt market for much of the year amid signs of a weakening Chinese economy and declining commodity prices. With speculation growing that the Federal Reserve will raise interest rates for the first time in nearly a decade and Puerto Rico’s fiscal crisis escalating, the flow of money into funds that invest in the riskiest munis has slowed to $1.2 billion this year, compared with $8.8 billion in 2014, Lipper US Fund Flows data show.

“You’re not seeing a tremendous amount of money coming in and really burning a hole in people’s pockets,” said Mark Paris, who runs a $7.3 billion high-yield muni fund from New York at Invesco Ltd. He said he or a colleague visited Florida and Texas to analyze the rail and methanol offerings, though he declined to say whether he’ll buy the bonds. “Size is becoming an issue — you’re not going to have every high-yield fund in these. There are only a certain amount of bonds funds can take.”

Large junk-bond deals are rare in the $3.7 trillion municipal market, which is mostly made up of states, cities, counties and school districts at little risk of defaulting. Until Puerto Rico issued $3.5 billion of general obligations last year, the biggest speculative-grade deal was $1.2 billion.

There are only 12 open-end funds focused on high-yield munis that have more than $1 billion in assets, data compiled by Bloomberg show. Many have large stakes in investment-grade borrowers like California, which has had its credit rating raised repeatedly since the recession as its finances improved.

By contrast, All Aboard Florida’s bonds are unrated, which is an indication they’d receive a junk rating. It’s parent, Florida East Coast Industries, was ranked seven steps below investment grade by Standard & Poor’s last year. The methanol-plant bonds for OCI N.V.’s Natgasoline LLC will probably have a rank three steps below investment grade, according to David Ambler, who analyzes high-yield munis at AllianceBernstein Holding LP in New York. The Puerto Rico agency, known as Prasa, has the third-lowest mark, Caa3, from Moody’s Investors Service.

Size An Issue

“The biggest issue that’s postponing these deals is just the absolute size of each one, and they’re certainly speculative,” said Mike Petty, manager of the $1.8 billion MainStay High Yield Municipal Bond Fund. “It’ll be difficult to get that many bonds done within our space. The underwriters have been trying to get crossover interest as well.”

With Puerto Rico veering toward default, some hedge funds and distressed-debt buyers may be leery of buying more high yield munis, said Invesco’s Paris. Such investors, know as crossover buyers because they’re not limited to specific markets the way mutual funds frequently are, hold as much as a third of the island’s $70 billion of debt, according to Mikhail Foux at Barclays Plc. Puerto Rico’s bonds have slumped more than 10 percent this year.

“There’s a lack of crossover hedge fund buyers who can come in and take up the slack of what the tax-exempt buyers don’t buy, and that’s slowed down the order process,” said Paris, whose fund has gained 3.8 percent this year, beating 93 percent of its high-yield peers. “I’ve been surprised at how long people have talked about these deals.”

High-yield munis have delivered lackluster gains this year. They’ve returned 0.8 percent, about half what was seen in the broad municipal market, Barclays data show. That’s partly because of Puerto Rico, whose bonds make up at least 25 percent of the index.

Gauging Risk

The offerings that have struggled to find buyers carry more risk than typical munis.

Puerto Rico’s sewer agency, which shelved a $750 million sale, could be swept up in the commonwealth’s debt restructuring, with Governor Alejandro Garcia Padilla seeking to persuade investors to accept less than they are owed. All Aboard Florida would be the first new privately run U.S. passenger railroad in more than a century, a project whose success will hinge on travelers’ willingness to abandon their cars in favor the 235-mile (378-kilometer) train line running from Orlando to Miami. The methanol plant is an effort to break into a business dominated by foreign competitors.

All Aboard Florida spokeswoman Melissa Shuffield didn’t return phone calls seeking comment. Omar Darwazah, a spokesman for OCI, didn’t respond to a phone call and e-mail seeking comment.

With interest rates near generational lows and the Federal Reserve signaling it may end its almost seven-year policy of keeping borrowing costs close to zero, investors are rightfully slow to commit to new deals, said Jim Murphy, who manages T. Rowe Price’s $3.3 billion high-yield fund from Baltimore.

“It’s that much more important to be careful when spreads are tight and rates are low like the environment we’re in,” Murphy said. “People are being really careful and that’s refreshing.”


I hope the above forex currency trading information was of help to you.

Anthony DiChi at TradeCurrencyNow,
America’s Forex News and Currency Information source.

The above information is opinion based except where noted. Always contact a licensed professional for information on the above subject or BEFORE applying or practicing the above information.

One of Four Financial / Stock Market Scenarios Will Happen

Below I have listed four possible economic situations that I believe currently have a high potential of coming to reality.

1) Inflation kicks in hard and fast.
Inflation must grow to support current and future growth of the Dow Jones Industrial Index prices.

I’m thinking the Feds are trying hard to pull this one off by printing dollars and are counting on this to help solve the debt problem. The FED hopes that printing dollars will also help jumpstart the world economy and help the USA maintain a strong financial currency position. It’s an all or nothing approach.

OR

2) Sharp Stock Market Correction Coming.
No inflation means no support for inflated stock prices.

This theory works against everything the Federal Reserve is counting on. It will mean that the Fed has failed to accomplish their above goal.

OR

3) Major expansion of world economic growth.
Expansion of economic markets world wide will help support the elevated prices of the mostly international stocks in the DOW Jones Industrial Index. Cost of hard goods goes up with some off setting efficiency plays.

An orderly world order must be maintained for this scenario to play out. As of today world order is going in the opposite direction.

OR

4) International conflict syndrome.
This is when essentials inflate and stocks drop fast and hard. Conflicts disrupt the sensitive trade routes around the globe.

This is a world war three type scenario and if US policy doesn’t change fast this can become reality quickly.

More likely than not (three out of four indicate inflation) I’m thinking inflation is coming and your trading and retirement plans should account for inflation.


I hope the above forex currency trading information was of help to you.

Anthony DiChi at TradeCurrencyNow,
America’s Forex News and Currency Information source.

The above information is opinion based except where noted. Always contact a licensed professional for information on the above subject or BEFORE applying or practicing the above information.

Is Now the Time to Buy Gold and Silver

Today gold is trading at about 1,330 U.S. Dollars.

My information and charts indicate that Gold has a target low of 1050 U.S. Dollars with a low range from $950.00 to $1,180.00.

My information and charts indicate that Silver has a target low of 17.80 U.S. Dollars with a low range from $16.00 to $19.00.

Here is a link to my last opinion on gold.

I hope the above forex currency trading information was of help to you.

Anthony DiChi at TradeCurrencyNow,
America’s Forex News and Currency Information source.

The above information is opinion based except where noted. Always contact a licensed professional for information on the above subject or BEFORE applying or practicing the above information.

Key Facts about Leverage in Forex Trading

Leverage is a term that many Forex brokers use in order to attract new accounts. A high leverage ratio is quoted to many unsuspecting potential Forex traders who believe that a broker that offers the highest leverage will be the most reliable. This is not the case. There are many things that should be considered by the trader before he starts to trade Forex.
Here are the main things a trader must know:
– Leverage is a loan that is offered to a Forex trader by his forex broker so that higher value trades can be placed in the market place. This loan is offered in the form of a ratio and is based on the trading account that has been chosen, the amount of money that you choose to invest and the specific country that you are operating in. (Some countries mandate specific leverage limitations).
– The levels of leverage offered in Forex trading are far higher than the margins that are offered in the equity markets. This is because currency prices do not fluctuate as much as stock prices in a day and the change is about 1 percent at an average.
– Leverage can be obtained from the Forex brokers after opening a margin account with the broker. This allows for a Forex trade that is much larger and can produce larger profits.
– When a trade moves in the expected direction, the amount taken from the broker is returned to him once the trade is closed. On the other hand, if the trade ends in a loss, the trader may encounter higher levels of loss due to the leverage that has been used.
– Leverage is an option that Forex traders should use judiciously in order to ensure that they do not end up losing their life savings.. The size of the Forex market is so large that a small mistake can sometimes lead to huge losses.
– When deciding on the amount of leverage to use, risk tolerance should be kept in mind. This is the amount of money that you can lose without risking your lifestyle and family requirements.
– Last but not the least; leverage should be used as a tool to ensure higher levels of liquidity and not as a loan at all times. You should be extremely sure of the trade that you are making if you do avavail of leverage beyond your financial situation.
All in all, leverage is a great tool that every Forex trader has at his or her disposal. The trader must know how to use it correctly.

I hope the above currency trading information was of help to you.

Anthony DiChi at TradeCurrencyNow,
America’s Forex News and currency information source.

Gold May Become a Tier One Asset

I received an email regarding gold officially being accepted as a tier 1 banking asset as of January 1st 2013.

Information indicates that the global banking regulatory group that meets in the small mountain town of Basel, Switzerland is responsible for setting global banking standards. They decide things like which assets qualify as Tier 1 assets, how much loan loss reserves banks need to hold, and how much leverage banks can take on.

Basel Committee on Banking Supervision

Officially known as the Basel Committee on Banking Supervision, it’s only met three times in the last 20 years. The first meeting was in 1988. The second meeting, Basel II, in 2004, was a disaster. The Basel banking geniuses allowed mortgage-backed securities to be considered a Tier 1 asset. (A Tier 1 rating means that the asset is considered a cash equivalent.) Of course, after the housing crash and ensuing Great Recession, we know that mortgage-backed securities are nowhere near as good as cash.

So in 2010, the committee met again to fix their past mistakes. It was at this meeting — known as Basel III — that the biggest news for gold in 40 years emerged.

Basel III will fundamentally change the way gold is valued by the financial markets.

The Basel Committee on Banking Supervision ruled that gold could be included as a Tier 1 asset. In other words, Basel III rules make gold just as good as cash or Treasury bonds.

Before Basel III, banks had to hold around 6% of the value of outstanding loans as collateral for those loans. Most of that 6% was comprised of what’s called Tier 1 assets: cash and company stock. (Treasury bonds count as cash.) After Basel III, banks are required to hold approximately 12% of Tier 1 capital. But the big news is that gold will now be considered a Tier 1 asset.

Prior to Basel III, a bank could only count 50% of gold’s market value as collateral. As of January 1, 2013, gold’s value will double as a banking asset.

Rumors have the European Union will adopt Basel III rules in January 2013. So will Russia and Japan. China, India, and even Pakistan are on board. Australia, New Zealand, Brazil, and South Africa, too.

ONE POINT is that gold that banks hold will double in qualifying asset value automatically. The banks will need to do nothing and gain 100% increase in their qualifying banking gold assets. This seems to be great for foreign banks, who many have been accumulating gold over the last several years and bad for most USA banks who mostly have not been accumulating gold.

SECOND POINT Will banks need or want to start buying more gold now or have they already made their major purchases of gold in anticipation of the effective date of January 1st 2013. Most likely, yes, (I would guess most if not all) major gold buying banks have long ago heard of this new Basel III gold reclassification asset upgrade rule to a tier 1 asset.

THIRD POINT The big question is, has the new Basel III banking rules requirement of 2010 named above been figured in to the price of gold? In my opinion most of the gold buying by banks has been completed in anticipation of the 2013 effective date.

The above information is opinion based except where noted. Always contact a licensed professional for information on the above subject or BEFORE applying or practicing the above information.

Anthony DiChi at TradeCurrencyNow,
America’s Forex News and currency information source.